





 Nexus Global
Maintenance Planning and Scheduling: Turning Work Into Results
 Nexus Global
Discover how proper work management can reduce costs, improve equipment reliability, and increase productivity during quarantine.

Busy doesn't always mean productive. Maintenance technicians can lose significant time searching for parts, traveling between jobs, and dealing with poorly planned work.
By improving planning, kitting, and schedule discipline, organizations can increase wrench time, reduce wasted labor, and help technicians spend more of their day doing the work they were hired to do.
Technician productivity isn’t a motivation problem, it’s a management system problem. When planning, kitting, and schedule discipline click, wrench time climbs, costs fall, and teams feel proud of the work they complete.
Some days I didn’t feel like working, and those days dragged. I looked busy because looking busy kept the questions away. The real problem? I wasn’t fully utilized. There wasn’t enough planned maintenance to keep me engaged for a full shift. A good day was simple: a full slate of well‑planned jobs, steady execution, and the satisfaction of real progress.
Utilization is a management outcome. Strong planners and schedulers change the math. When 18% of a tech’s day is spent hunting parts and 24–26% is spent walking to and from jobs, nearly half the day creates no value. Planning and kitting reclaim that time.
Plan the work: technicians stop planning on the fly; job plans bring consistency.
Kit the work: parts, tools, and permits staged in advance; less time lost to searching.
Together, these levers can lift wrench time by ~50%.
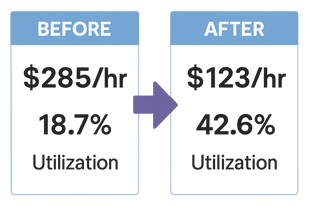
Before: 22‑person crew at 18.7% utilization—the equivalent of ~15 FTE idle while seven carried the load; effective labor $285/hour to complete work.
Actions: two techs moved into planner roles; implemented kitting; trained supervisors to remove obstacles and manage in the field.
After (quickly): 42.6% utilization; effective labor $123/hour; inventories −19.8% thanks to better planning and normal lead times.
The assessment revealed a brittle setup: high turnover and no formal engineering team, with supervisors moonlighting as planners and pushing next-day schedules—so no real planning occurred.
Techs repairing on the fly; poor documentation.
81% of corrective work marked “48 hours”
13% of corrective work marked “24 hours”—no prioritization logic.
Utilization <12%; bloated inventory and expedite fees exceeding material costs.
Asset management framework: FMECA/strategies/PMs to align risk and effort.
Work management process guide: identify → plan → schedule → execute → close → analyze.
Material management guide: demand planning, kitting, right part/right time.
Data management guide: hierarchy, BOMs, failure/cause codes, and data quality rules.
Roles & responsibilities: supervisors supervise; dedicated planners and schedulers; assign resources to PdM.
New structure: 1 maintenance manager; 4 supervisors; 4 planners; 2 schedulers.
Weekly scheduling meeting with schedule freeze; storeroom kits PMs & planned work.
Writing process guides; CMMS cleanup (status/failure codes, backlog).
Outcomes: visible culture shift, lower turnover, and restored confidence in maintenance.
30 days
Stand up planning: top 20 job plans (scope, tools, parts, safety, estimates).
Publish priority + SLA matrix; stop marking everything urgent.
Lock failure/cause code sets; require time/parts at closeout.
60 days
Formal plan–schedule cadence with readiness gates and freeze.
Launch kitting for PMs and planned corrective work.
Supervisors coach in the field; verify closeout quality.
90 days
Move 1–2 high‑caliber techs into planner roles.
Review inventory vs planned demand; cut expedites; normalize lead times.
Run 1st RCA cycle; update strategies, job plans, and BOMs; publish a change log.
Leading: plan coverage, kit completeness, schedule adherence, closeout completeness (% time/parts/failure/cause).
Lagging: utilization/wrench time, rework rate, maintenance cost/asset, availability.
Supervisors doing planning “on the side”; no schedule freeze; constant break‑ins; overlong low‑value PMs; missing BOMs; weak failure/cause coding; treating the CMMS like a filing cabinet, not a system of work.

Discover how proper work management can reduce costs, improve equipment reliability, and increase productivity during quarantine.
.png)
How Nexus Global optimized work planning and asset strategies at West Africa’s largest container terminal in Nigeria—boosting uptime and cost...

The average maintenance technician utilization is between 17% - 22%! Do organizations pay the Tech 20% of their hourly rate? Of course not!
 Ken Arthur | CRL